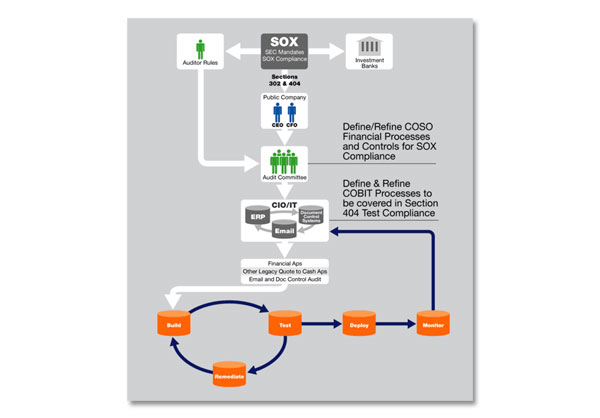

FocusFrame needed a chart to show how Sarbanes-Oxley (SOX) affects a company and how FocusFrame's software solutions can help. I was provided with a rough sketch and cleaned it up for a PowerPoint presentation. FocusFrame's role in the process is represented by the orange objects and blue arrows.
©2013 Pete Gascoyne